


Planning an Personalized Virtual Expo is an exhilarating journey filled with creativity, networking, and the promise of new opportunities. But once the confetti settles and the last attendee logs off, how do you know if your event truly hit the mark? Measuring success might sound daunting, but it can be a fun and insightful process that helps you celebrate your wins and learn from your experiences. Let’s dive into some friendly and effective ways to gauge just how impactful your event was!
Imagine wrapping up your event and having a treasure trove of data at your fingertips, ready to reveal the magic behind your success! From understanding attendee engagement to calculating your return on investment, measuring the success of your Personalized Virtual Expo can be as exciting as the event itself. So grab a cup of coffee, and let’s explore the best strategies to ensure your next event is even more spectacular!
1. Define Key Performance Indicators (KPIs)
Before your event takes place, it’s crucial to establish clear Key Performance Indicators (KPIs) that align with your specific objectives. KPIs serve as measurable values that indicate how effectively you are achieving your goals. Common KPIs for Personalized Virtual Expos include attendance rate, engagement levels, lead generation, and conversion rates.
- Attendance Rate: The percentage of registered attendees who actually participated in the event. This metric helps gauge the effectiveness of your marketing efforts.
- Engagement Levels: Measured through interactions such as chat messages, private video calls, and participation in polls or quizzes. High engagement levels indicate that attendees are actively involved.
- Lead Generation: The number of qualified leads collected during the event, such as sign-ups for newsletters, requests for product demos, or inquiries about services.
- Conversion Rates: The percentage of leads that convert into customers post-event, providing insight into the effectiveness of your sales efforts.
For instance, if your primary goal is to generate leads, you might track the number of qualified leads collected during the event. By defining these metrics in advance, you create a framework that allows you to assess the event’s success quantitatively.
For instance, if your primary goal is to generate leads, you might track the number of qualified leads collected during the event. This could involve monitoring how many attendees signed up for newsletters, requested product demos, or expressed interest in your services. By defining these metrics in advance, you create a framework that allows you to assess the event’s success quantitatively.
Additionally, consider setting benchmarks for each KPI based on past events or industry standards. This will give you a clearer picture of what success looks like and help you identify areas for improvement. For example, if your previous event had a 20% attendance rate, aim to exceed that figure in your upcoming event.
2. Utilize Analytics Reports
One of the most powerful tools at your disposal is Hi-Fella’s Analytics Report feature. This tool provides comprehensive insights into attendee behavior and engagement during the event. By analyzing data such as booth traffic, session attendance, and interaction rates, you can gain a deeper understanding of how attendees engaged with your event.
- Traffic: The number of visitors each exhibitor received, which helps assess the effectiveness of exhibitor visibility.
- Session Attendance: The number of participants in each presentation or workshop, indicating which topics resonated most with attendees.
- Interaction Rates: The frequency of interactions, such as private video calls and chat messages, which reflects attendee engagement.
For example, you can track how many visitors each exhibitor received, which presentations attracted the most participants, and how frequently attendees engaged in private video calls. This data not only highlights the most popular aspects of your event but also reveals which areas may need improvement. If certain sessions had low attendance, it may indicate that the topics were not relevant to your audience or that the timing was not ideal.
Moreover, these analytics can help you identify trends over time. By comparing data from multiple events, you can see what strategies have consistently worked and which ones have not. This longitudinal analysis will empower you to make data-driven decisions for future events, ensuring continuous improvement.
3. Gather Feedback from Attendees
Collecting feedback from attendees is a vital step in measuring the success of your event. Use surveys or polls during and after the event to gather insights on various aspects of the experience. Questions can range from overall satisfaction levels to specific feedback on content relevance and speaker effectiveness.
For instance, you might ask attendees to rate their satisfaction on a scale of 1 to 10 and provide open-ended questions for additional comments. This qualitative data can reveal valuable insights into what attendees enjoyed and what they felt could be improved. If many attendees express a desire for more interactive sessions, you can incorporate that feedback into your planning for future events.
Additionally, consider using real-time feedback tools during the event. This allows you to make immediate adjustments based on attendee responses. For example, if a particular session is receiving negative feedback, you can address the issue on the spot or adjust the content for future presentations.
4. Analyze Post-Event Engagement
After the event concludes, it’s important to monitor how attendees engage with your brand in the days and weeks that follow. This can provide insights into the long-term impact of your event on brand awareness and customer relationships. Key metrics to track include follow-up interactions, social media engagement, and website traffic.
For example, track how many attendees reach out for more information or schedule follow-up meetings after the event. This can indicate the effectiveness of your lead generation efforts and the overall interest in your products or services. Additionally, monitor social media platforms for mentions, shares, and comments related to your event. A high level of engagement on social media can amplify your event’s reach and enhance brand visibility.
Website traffic is another critical metric to analyze. Look for any spikes in visits to your website or specific landing pages that occurred after the event. This can help you assess whether your event successfully drove interest in your offerings and whether attendees are seeking more information about your brand.
5. Calculate Return on Investment (ROI)
Finally, evaluating the financial success of your event is essential for understanding its overall impact. Calculating Return on Investment (ROI) allows you to assess whether the event was worth the resources invested. To do this, consider both the total revenue generated from the event and the total costs incurred.
Start by calculating the total revenue generated, which may include sales directly attributed to the event, sponsorships, and any other income streams. Next, tally up all event-related costs, including marketing expenses, technology fees, and operational costs. The formula for ROI is:
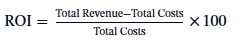
A positive ROI indicates that your event was financially successful, while a negative ROI may highlight areas for improvement. By analyzing ROI, you can make informed decisions about future investments in events and refine your strategies to maximize profitability.